TxGal
Day by day
Sierra Mountains Log Up To 6 Feet Of October Snow, Record Lows Sweep Scandinavia, + "Remarkable" Cold Spell Hits Hong Kong - Electroverse

Extreme Weather GSM
SIERRA MOUNTAINS LOG UP TO 6 FEET OF OCTOBER SNOW, RECORD LOWS SWEEP SCANDINAVIA, + “REMARKABLE” COLD SPELL HITS HONG KONG
OCTOBER 26, 2021 CAP ALLON
SIERRA MOUNTAINS LOG UP TO 6 FEET OF OCTOBER SNOW
Heavy snow has been pounding the higher elevations of the Western U.S. in recent days, with record-challenging accumulations hitting some peaks and summits.
Early measurements on Monday saw totals nearing the 2 feet mark as a Level 5 out of 5 atmospheric river met with a descending Arctic air mass:
View: https://twitter.com/NWSSacramento/status/1452687746577756160
View: https://twitter.com/UCB_CSSL/status/1452657396241735680
Run time is 0:26
View: https://twitter.com/KCRATeSelle/status/1452632383438479360
Run time is 0:26
View: https://twitter.com/TahoeWeather/status/1452659538910322693
As the day progressed so did the snowfall totals.
So far, up to 6 feet of global warming goodness has been registered in some parts–at elevations above 8,000 ft.
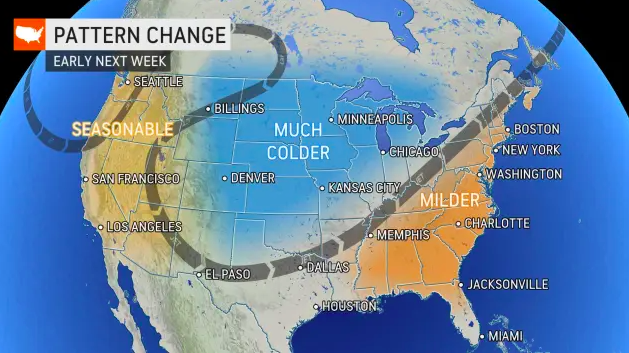
The latest GFS model (shown below) reveals that this heavy, early-season snow is set to persist through Tuesday and Wednesday, with another round of bone-chilling lows and record-breaking snows clipping large swathes of the North American continent next week:

GFS Total Snowfall (inches) Oct 26 – Nov 11 [tropicaltidbits.com].
RECORD COLD SWEEPS SCANDINAVIA
Scandinavia’s much anticipated Arctic blast peaked on Sunday and it didn’t disappoint, delivering record low temperatures and heavy snowfall.
As reported by mkweather.com, a total of 9 meteorological stations across Sweden and Finland reported morning minimums in the -20 to -25C (-4 to -13F) rang. A low of -24.6C (-12.3F) was observed in Nattavaara — Scandinavia’s coldest October temperatures for 15 years (since 2006).
Regional record October lows were also registered: Latnivaara, Sweden, for example, suffered -23.5C (-10.3F); Nikkaluokta, also Sweden, logged -23C (-9.4F); while Salla, Finland observed -21.5C (-6.7F).
View: https://twitter.com/ThierryGooseBC/status/1452151886275137538
The -24C originally registered in Nattavaara (since confirmed as -24.6C).
The mkweather.com article links Scandinavia’s “extreme early cold blast” to 1) a persistent NAO phase, and 2) an “anomalously cold Arctic” which has led to impressive ice growth (only 3 years out of the last 15 have seen a higher Arctic sea ice extent).
The mk article also recalls the recent record October low registered on the Greenland Plateau where an automatic meteorological station measured an “excessively low” -50.8C (-59.4F) last week — a record reading for mid-October.
Accompanying Scandinavia’s big freeze, northern parts of Sweden, Norway and Finland have all reported anomalous dumps of snow totaling as much as half a meter (1.64 feet) — “such high snow cover hasn’t been measured here in October in decades”.
After a brief reprieve, “anomalously cold winter conditions should return already around late November and in December and early January,” concludes the mk article, “when, according to many sources, extreme Arctic and Siberian blasts in Europe are possible.”
“REMARKABLE” COLD SPELL HITS HONG KONG
After a toasty start to October, Hong Kong is now suffering what is being described as a “remarkable” cold spell.
On Friday, October 22 the mercury at the Hong Kong International Airport dropped to 16.8C — the weather stations second lowest October temperature in recorded history (beaten only by a reading in 1997–solar minimum of cycle 23).
Nearby Tai Moh Shan Peak plunged to 9.9C — HK’s earliest reading below 10C also since 1997.

[HKO]
Today’s article was a quick one. I have a meeting scheduled at my local town hall here in central Portugal. I’m trying to obtain planning permission for a small house. I don’t speak much Portuguese, they don’t speak much English — this should be fun...
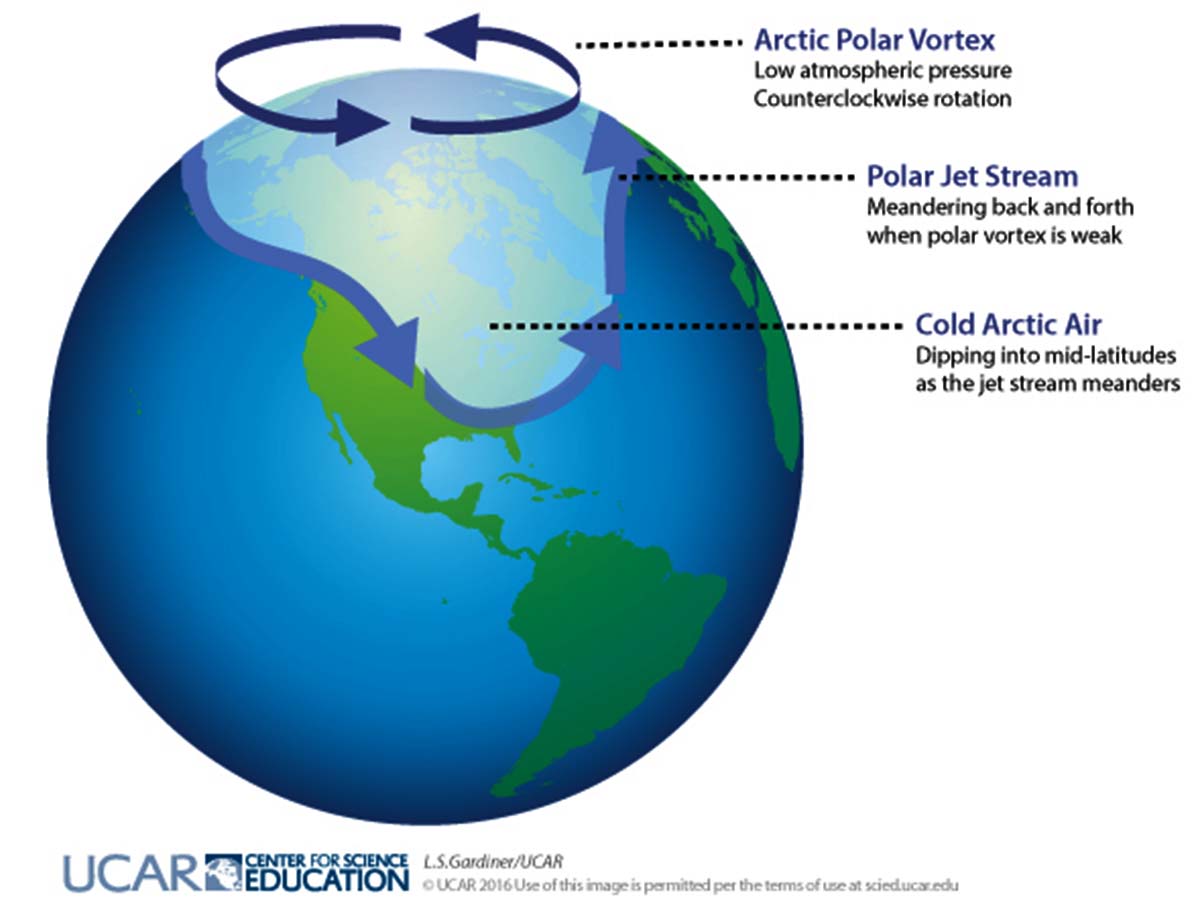
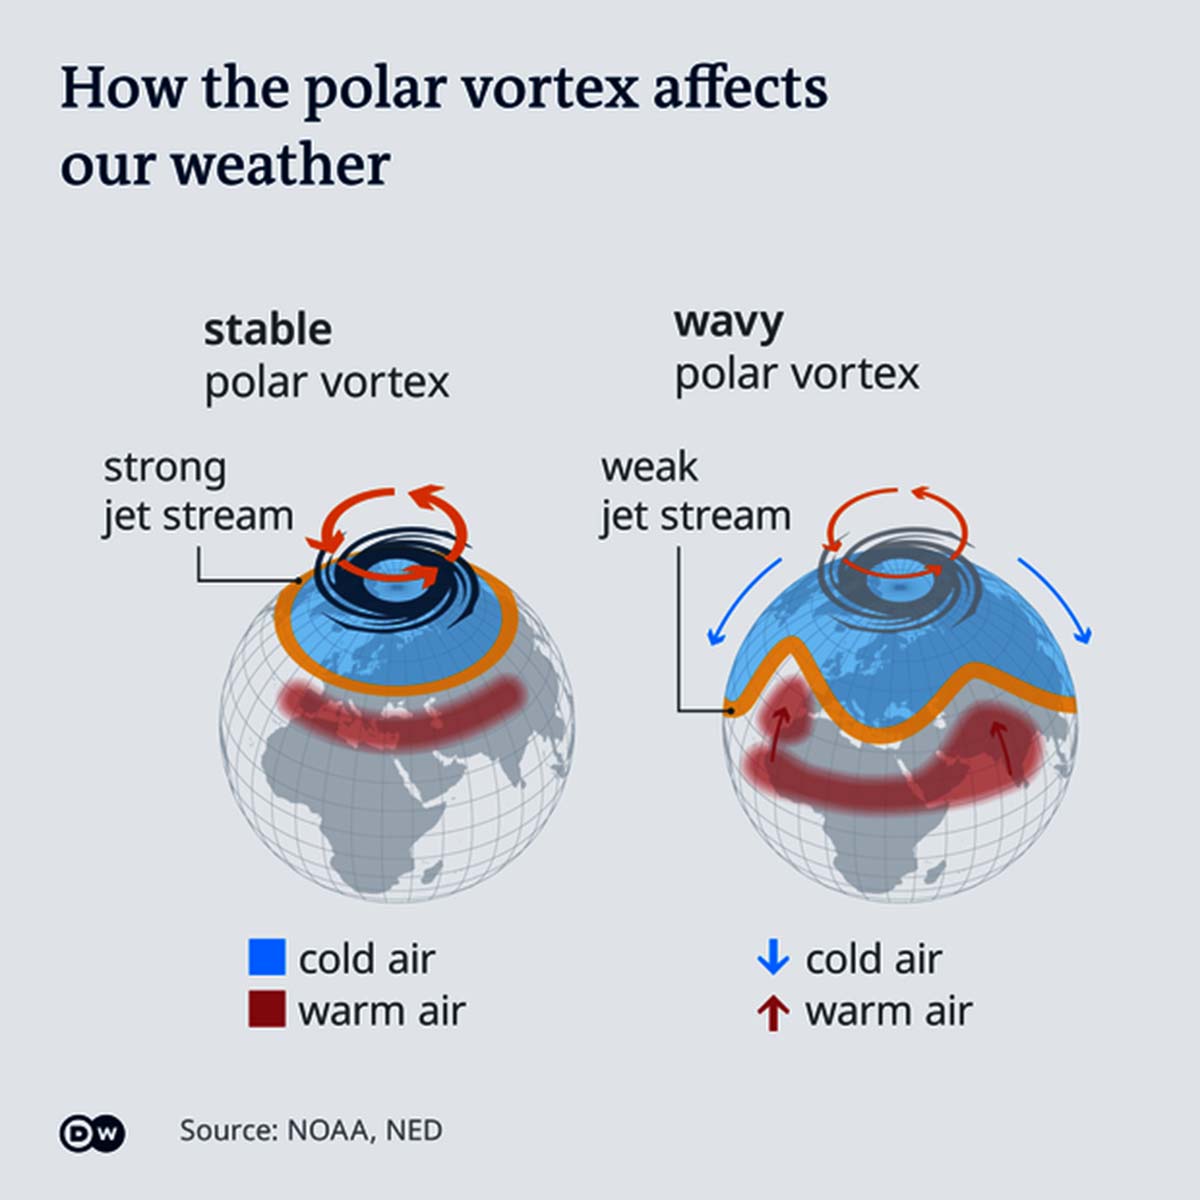
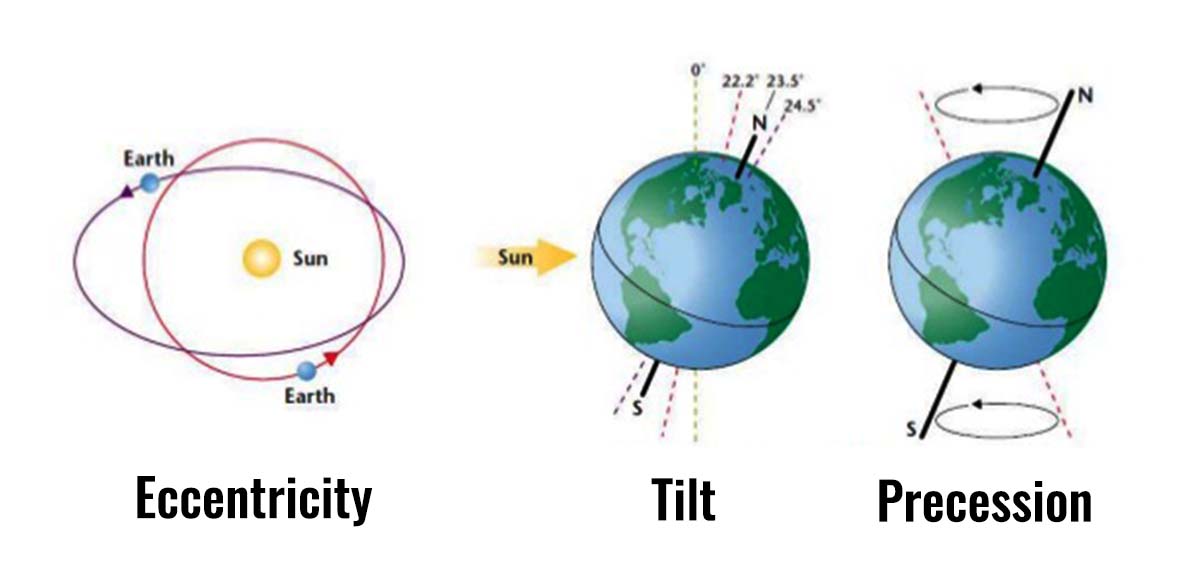
The COLD TIMES are returning, the mid-latitudes are REFREEZING, in line with the great conjunction, historically low solar activity, cloud-nucleating Cosmic Rays, and a meridional jet stream flow (among other forcings).
Both NOAA and NASA appear to agree, if you read between the lines, with NOAA saying we’re entering a ‘full-blown’ Grand Solar Minimum in the late-2020s, and NASA seeing this upcoming solar cycle (25) as “the weakest of the past 200 years”, with the agency correlating previous solar shutdowns to prolonged periods of global cooling here.
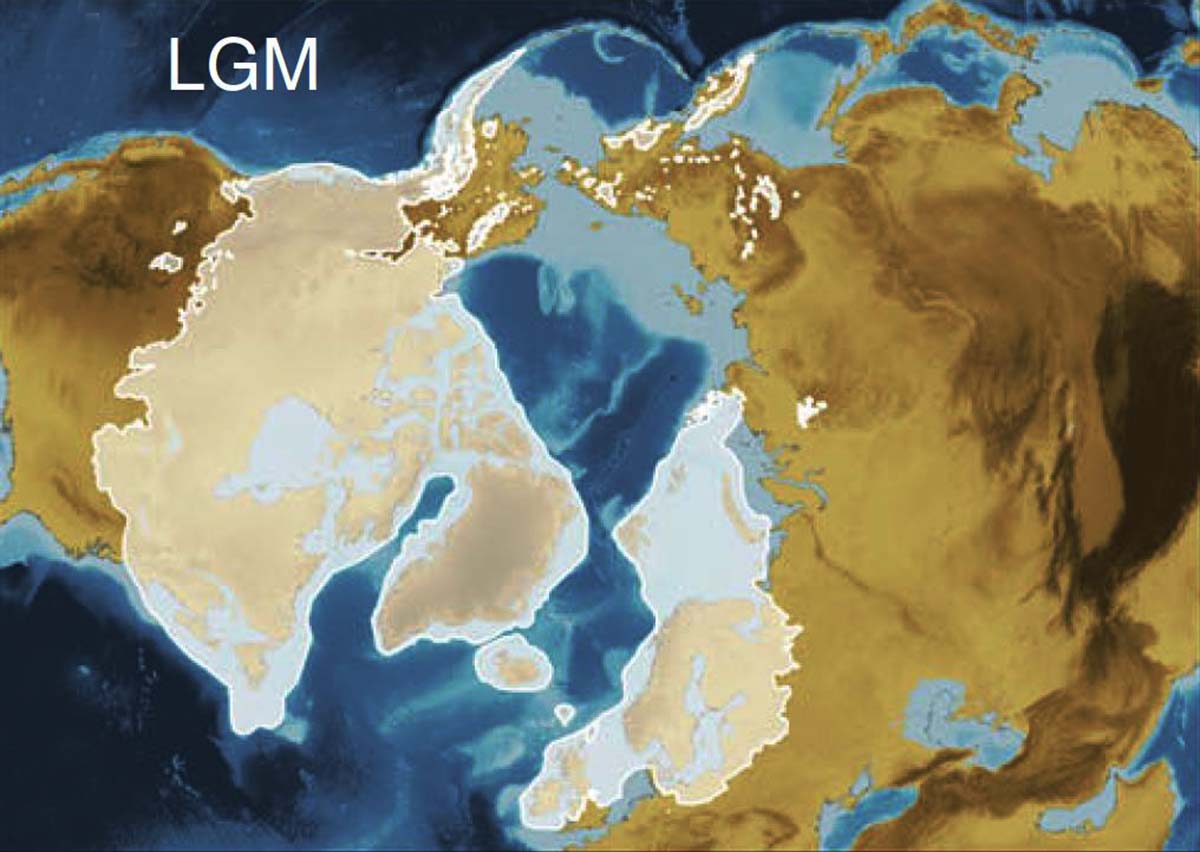
Furthermore, we can’t ignore the slew of new scientific papers stating the immense impact The Beaufort Gyre could have on the Gulf Stream, and therefore the climate overall.


Prepare accordingly— learn the facts, relocate if need be, and grow your own.
Extreme Weather GSM
SIERRA MOUNTAINS LOG UP TO 6 FEET OF OCTOBER SNOW, RECORD LOWS SWEEP SCANDINAVIA, + “REMARKABLE” COLD SPELL HITS HONG KONG
OCTOBER 26, 2021 CAP ALLON
SIERRA MOUNTAINS LOG UP TO 6 FEET OF OCTOBER SNOW
Heavy snow has been pounding the higher elevations of the Western U.S. in recent days, with record-challenging accumulations hitting some peaks and summits.
Early measurements on Monday saw totals nearing the 2 feet mark as a Level 5 out of 5 atmospheric river met with a descending Arctic air mass:
View: https://twitter.com/NWSSacramento/status/1452687746577756160
View: https://twitter.com/UCB_CSSL/status/1452657396241735680
Run time is 0:26
View: https://twitter.com/KCRATeSelle/status/1452632383438479360
Run time is 0:26
View: https://twitter.com/TahoeWeather/status/1452659538910322693
As the day progressed so did the snowfall totals.
So far, up to 6 feet of global warming goodness has been registered in some parts–at elevations above 8,000 ft.
The latest GFS model (shown below) reveals that this heavy, early-season snow is set to persist through Tuesday and Wednesday, with another round of bone-chilling lows and record-breaking snows clipping large swathes of the North American continent next week:

GFS Total Snowfall (inches) Oct 26 – Nov 11 [tropicaltidbits.com].
RECORD COLD SWEEPS SCANDINAVIA
Scandinavia’s much anticipated Arctic blast peaked on Sunday and it didn’t disappoint, delivering record low temperatures and heavy snowfall.
As reported by mkweather.com, a total of 9 meteorological stations across Sweden and Finland reported morning minimums in the -20 to -25C (-4 to -13F) rang. A low of -24.6C (-12.3F) was observed in Nattavaara — Scandinavia’s coldest October temperatures for 15 years (since 2006).
Regional record October lows were also registered: Latnivaara, Sweden, for example, suffered -23.5C (-10.3F); Nikkaluokta, also Sweden, logged -23C (-9.4F); while Salla, Finland observed -21.5C (-6.7F).
View: https://twitter.com/ThierryGooseBC/status/1452151886275137538
The -24C originally registered in Nattavaara (since confirmed as -24.6C).
The mkweather.com article links Scandinavia’s “extreme early cold blast” to 1) a persistent NAO phase, and 2) an “anomalously cold Arctic” which has led to impressive ice growth (only 3 years out of the last 15 have seen a higher Arctic sea ice extent).
The mk article also recalls the recent record October low registered on the Greenland Plateau where an automatic meteorological station measured an “excessively low” -50.8C (-59.4F) last week — a record reading for mid-October.
Accompanying Scandinavia’s big freeze, northern parts of Sweden, Norway and Finland have all reported anomalous dumps of snow totaling as much as half a meter (1.64 feet) — “such high snow cover hasn’t been measured here in October in decades”.
After a brief reprieve, “anomalously cold winter conditions should return already around late November and in December and early January,” concludes the mk article, “when, according to many sources, extreme Arctic and Siberian blasts in Europe are possible.”
“REMARKABLE” COLD SPELL HITS HONG KONG
After a toasty start to October, Hong Kong is now suffering what is being described as a “remarkable” cold spell.
On Friday, October 22 the mercury at the Hong Kong International Airport dropped to 16.8C — the weather stations second lowest October temperature in recorded history (beaten only by a reading in 1997–solar minimum of cycle 23).
Nearby Tai Moh Shan Peak plunged to 9.9C — HK’s earliest reading below 10C also since 1997.
[HKO]
Today’s article was a quick one. I have a meeting scheduled at my local town hall here in central Portugal. I’m trying to obtain planning permission for a small house. I don’t speak much Portuguese, they don’t speak much English — this should be fun...
The COLD TIMES are returning, the mid-latitudes are REFREEZING, in line with the great conjunction, historically low solar activity, cloud-nucleating Cosmic Rays, and a meridional jet stream flow (among other forcings).
Both NOAA and NASA appear to agree, if you read between the lines, with NOAA saying we’re entering a ‘full-blown’ Grand Solar Minimum in the late-2020s, and NASA seeing this upcoming solar cycle (25) as “the weakest of the past 200 years”, with the agency correlating previous solar shutdowns to prolonged periods of global cooling here.
Furthermore, we can’t ignore the slew of new scientific papers stating the immense impact The Beaufort Gyre could have on the Gulf Stream, and therefore the climate overall.
Prepare accordingly— learn the facts, relocate if need be, and grow your own.