Electroverse
Articles Crop Loss Extreme Weather
South America’s Antarctic Blast Pushes North, Sending Temps Crashing Into The Tropics; “Severe Summer Snowfall” Causes Mass Livestock Deaths In N. India And Pakistan; Record August Chills Sweep Morocco; + Rare Summer Freeze Strikes Iceland
August 19, 2022 Cap Allon
South America’s Antarctic Blast Pushes North, Sending Temps Crashing Into The Tropics
Argentina has been suffering an exceptionally cold and snowy 2022.
The nation saw its coldest autumn
(March-April-May) since 1976 earlier in the year; witnessed its coldest month of June in two decades; suffered a frigid July with historic snowstorms; with similarly fierce storms returning in August (
this week, in fact).
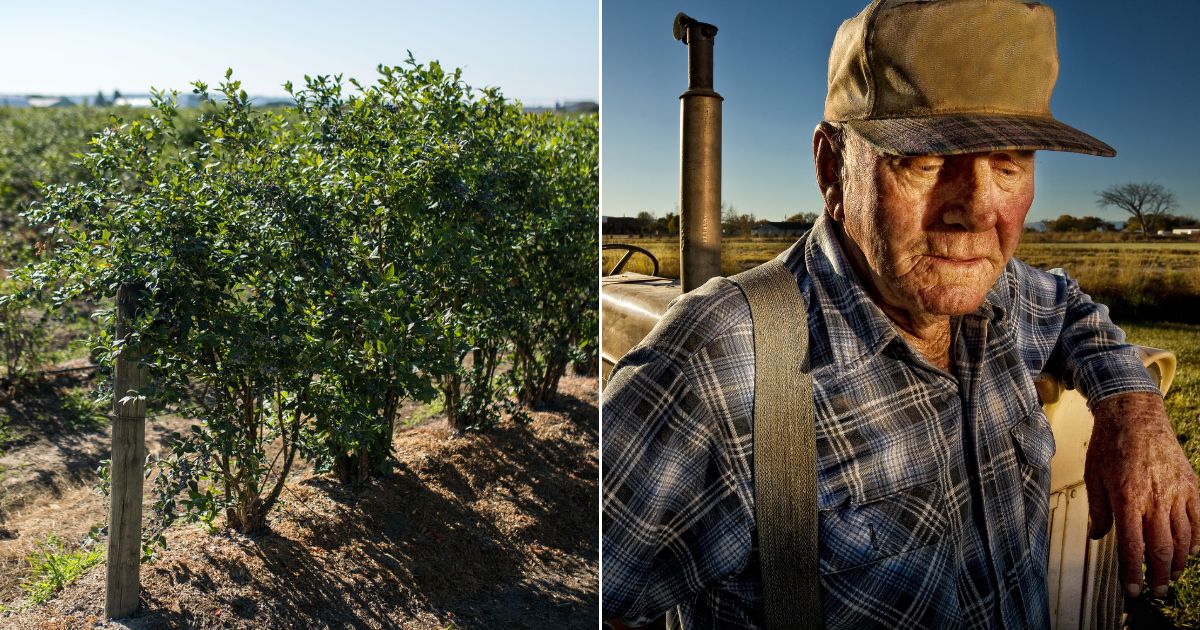
Unfortunately for Argentina–and for the South American continent as a whole–the injection of polar cold is now pushing north, forecast to drive into the tropics over the coming days and threaten Brazil’s key Sarinha crop from which 70% of the nation’s corn is produced.
A mass of Antarctic air began buffeting the region Thursday, according to Brazil’s National Institute of Meteorology (INMET); and by Sunday, harsh frosts are forecast to ravage Rio Grande do Sul, Santa Catarina, and Parana–among other locales.
During the past two decades, Brazilian farmers have gotten used to “double-cropping” soybeans and corn. Double-cropping has seen the country to use its unique climate to increase annual yields, and it is the main reason Brazil has risen to become the main competitor to U.S. exports for both crops.
However, the window is tight; and as you’d expect, the Grand Solar Minimum looks to be closing that window.
Like most tropical locales, Brazil has a distinct wet and dry season. Over the past few decades, the wet season has lasted roughly September to May, allowing a good soybean crop in the spring and summer, followed by a good front-half to the corn season before turning drier. However, if the season does not go as planned–for any reason–catastrophe can easily strike — and this is the threat this season, and was the reality last year after record-breaking freezes routinely hammered key growing regions which left soybean, corn, sugarcane and coffee crops decimated in their wake:
 Maja Wallengren
@SpillingTheBean
Maja Wallengren
@SpillingTheBean
*It's SNOWING across many parts in southern Brazil as coffee producing areas suffer SEVERE damage from coldest freeze in decades even PRIOR to next 4 days cold, damage WILL grow and there will be no major recovery until 2025 harvest.
https://t.co/ep3a70rTsV https://t.co/2yVR41rySc
 2:04 AM · Jul 29, 2021
It was noted that Brazil’s coffee crops will take years to recover from 2021’s big freeze, and now many of these same regions are about to be hit again. Below is a look at the Antarctic outbreak set to move in, according to the latest GFS run:
2:04 AM · Jul 29, 2021
It was noted that Brazil’s coffee crops will take years to recover from 2021’s big freeze, and now many of these same regions are about to be hit again. Below is a look at the Antarctic outbreak set to move in, according to the latest GFS run:

GFS 2m Temperature Anomalies (C) Aug 18 – Aug 22 [
tropicaltidbits.com].
And looking further ahead, another blast is set to push north as the calendar nears September:

GFS 2m Temperature Anomalies (C) Aug 28 [
tropicaltidbits.com].
The planet is cooler than they’d have you believe
Below are the temperature anomalies for today, August 19, according to the Climate Change Institute at the University of Maine.
Clear to see, but I’ll spell it out anyway, Earth is
not suffering some CO2-induced bout of terrifying terra firma broiling, quite the opposite, in fact: the planet is COOLING, and has been since 2016.
Today’s global average temperature–if such a thing can even be measured–OFFICIALLY stands at just
0.1C above the 1979-2000 base:

[
climatereanalyzer.org]
I believe that the elites know full well that time is ticking on their anthropogenic global warming narrative
(scam). Just look at the additional ‘catastrophes’ they’ve thrown at us over the past few years. All have been exaggerated, if not completely fabricated, and all just so happened to result more and more government intervention and overreach. One even resulted in a mandated experimental gene therapy: no jab, no job, which, no matter how you look at it, can only be considered a terrible thing. Forcing injections into people? That is a bad road to willingly trot down. Those who backed the mandates should be ashamed of themselves. Those who implemented the policy ought to be put on trial and imprisoned.
Looking ahead, it doesn’t take a crystal ball to project what’s next: Economic melt down (perhaps preceded by a melt up) with global food and energy shortages, i.e. famine.
Be sure to work yourself and your loved ones into a position whereby you can resist their digital IDs and CBDCs when they’re dangled in front of you during the depths of this coming economic misery. Despite the rhetoric and compelling marketing campaign, these measures will not be your savoir to the hell that
they themselves would have instigated with their ill-conceived climate policies and total annihilation of the global supply chain–most notably crop inputs (fertilizers, and the like).
I’ll say it again:
Resist. Resist. Resist. Don’t let them buy you when you’re down.
“Severe Summer Snowfall” Drives Mass Livestock Death In Northern India And Pakistan
One I missed from June–thank you to a reader for pointing it out: Every spring, some 300,000 livestock are herded up to Kashmir’s Neelum valley to graze on the abundance of summer. This year, however, herders were met by severe summer snow.
In late-June, 4 feet of snow accumulated across the Neelum Valley, killing thousands of livestock–mainly goats.
“We lost 107 goats due to the June snowfall”, said one herder from Mansehra, in Pakistan, who, along with two fellow farmers walked their 650 goats and sheep some 200km to the pastures at Ratti Galli in the Neelum Valley.
“We were not expecting snowfall, nor was there any prior warning,” said the herder.
Another herder with 1,025 sheep and goats lost 240 animals, mostly goats, to the summer snow. But as well as the cold and snow itself, the inclement conditions brought other unseasonal dangers: “Some of our goats were killed by local bears that normally stay on top of the mountains but come down during winter snowfalls,” he said.

A herder gathers his goats by the Hans Raj Lake in Neelam Valley [Sajid Mir].
The snowfall swept both Northern Indian and Pakistan.
On the Indian side, the pastures and valleys around Marsar Lake in south Kashmir provide a summer refuge for almost two million sheep belonging to 70,000 farmers, according to
data compiled by the region’s sheep husbandry department.
This year, however, the usually safe summer refuge was hit by rare blizzards that brought heavy losses to the herders. It snowed constantly between 19 and 22 June, coating the lush green meadows with a layer of snow some 3 feet deep, according to the shepherds — an incident that the administration of Jammu and Kashmir declared a
State Specific Natural Disaster.
“I have lived all the summers of my life in these mountains. It had never happened before, that it would snow in June,” said herder Assadulla Chopan, who had traveled to the pasture with his 1,600-strong flock of sheep in early-June.
“I felt my hour of death had come,” recalled Chopan. “I prayed for forgiveness and thought this is how my life is going to end.”
Chopan lost 100 sheep to the storm — many died from the cold, while others fell off a cliff as they tried to escape the icy winds.
After an official count, at least 7,000 sheep perished in the snowstorm, with many more goats lost.
As always, and no matter the climatic phenomenon, the establishment returns to the same old dogma:
Global Warming.
Completely ignoring the fact that, 1) the sun is experiencing its lowest activity for 200 years (since the Dalton Minimum), and 2) the impact such a decrease in solar output has on the Earth’s jet streams as well as other climatological forcings.
“We are in the midst of a severe climate crisis,” said Irfan Rashid, assistant professor at the University of Kashmir’s Department of Geo-Informatics. “[Climate change] will expose mountain communities and infrastructure to such unheard-of-in-the-past events,” he continued. “This is getting out of control.”
Fear and superstition are clearly rife, even in academic fields.
We humans may have made stupendous technological advances and improved living standards dramatically, but our brains are wired just as they were tens of thousands of years ago, and beyond, when we would offer-up sacrificial virgins to the Gods in the hope of receiving good growing conditions in return. And so, like the sheep of the Neelum valley we humans are just as easily led, only not but the promise of lush meadows–although metaphorically, perhaps–but by fantastical tales of existential threat and mortality.
Sardar Sarfraz, a meteorologist at the Pakistan Meteorological Department, echos Rashid’s sentiments: “We haven’t seen or heard of snow falling in June before … We can link it to climate change because it is a rare phenomenon”–a baffling run of logic there, one that the ‘face-palm’ emoji was surely created for. What a baseless pile of claptrap. And simultaneously, what a perfect summation of today’s cLiMaTe ScIeNcE:
“I can’t explain what just happened, so it must be caused by today’s boogeyman”.
Sardar Muhammad Rafiq, director of the Pakistan’s Environment Protection Agency, believes “It would be too early to say this snowfall is a climate change phenomenon. We would call it climate change only if it repeats next year.”

Herders such as Chopan haven’t been made aware of “global warming” or the “climate crisis”, yet their explanation for why this summer’s unprecedented snow rings similarly superstitious bells. The herders find refuge in their faith, rather than in the science: “There is a shrine in these mountains and its custodian these days is not a good man, that is why this happened,” said Chopan of this summer’s deadly blizzards.
Record-Breaking August Chills Sweep Morocco
Summer chills have swept Morocco this week.
With a low of 11.2C (52.2F) at Rabat Airport, August’s minimum temperature benchmark has been busted.
And looking a little north, parts of Europe have swung from hot to cold, record winds have been noted in Corica, while very cool conditions have been felt in both Northern Spain and Italy, with temperature records challenged.
Portugal, too–where I’m based–has experienced a sharp cool-down. Earlier in the week, temperatures dipped to 27C (80F) in many low-lying central regions (colder across the mountainous regions, of course) — that’s some 8C below the seasonal norm.
Grand Solar Minimum and the Swing Between Extremes

Intense bursts of heat will linger in one area, while a teeth-chattering chill will dominate nearby — and then the regions will “switch”. It’s this chopping and changing that will hasten the failure of our modern food production systems — crops will fail, on a large scale, and famine will quickly ensue.
Rare Summer Freeze Strikes Iceland
Cold and snowy weather has prevailed in Iceland this summer.
This week, minimums reached -4.4C (24.1F) in inhabited areas, and -10.3C (13.5F) on the top of the glacier (at 1690m).
According to the official data, 22% of inhabited area stations have recorded freezing lows of late — an incredibly rare feat for mid-August.
 Thierry Goose
@ThierryGooseBC
Thierry Goose
@ThierryGooseBC
Very cold night in #Iceland on Aug. 16th. ️-4.4°C in inhabited areas & -10.3°C in the mountains. If I'm not wrong, it's very close to the national August records which are -5.5°C in Grímsstaðir (1943) for inhabited areas & -10.5°C in Dyngjujökull (2017) for the mountains.
https://t.co/K8RcTeOFIt
4:48 PM · Aug 18, 2022
Moreover, Iceland’s cold and cloudy summer has led to well-below average glacier melt (similarly to what we’re seeing on Greenland), which could translate to a net mass balance GAIN (see below).
Persistent snowfall has been noted in June, July AND August as Earth edges ever-nearer to its next Grand Solar Minimum.
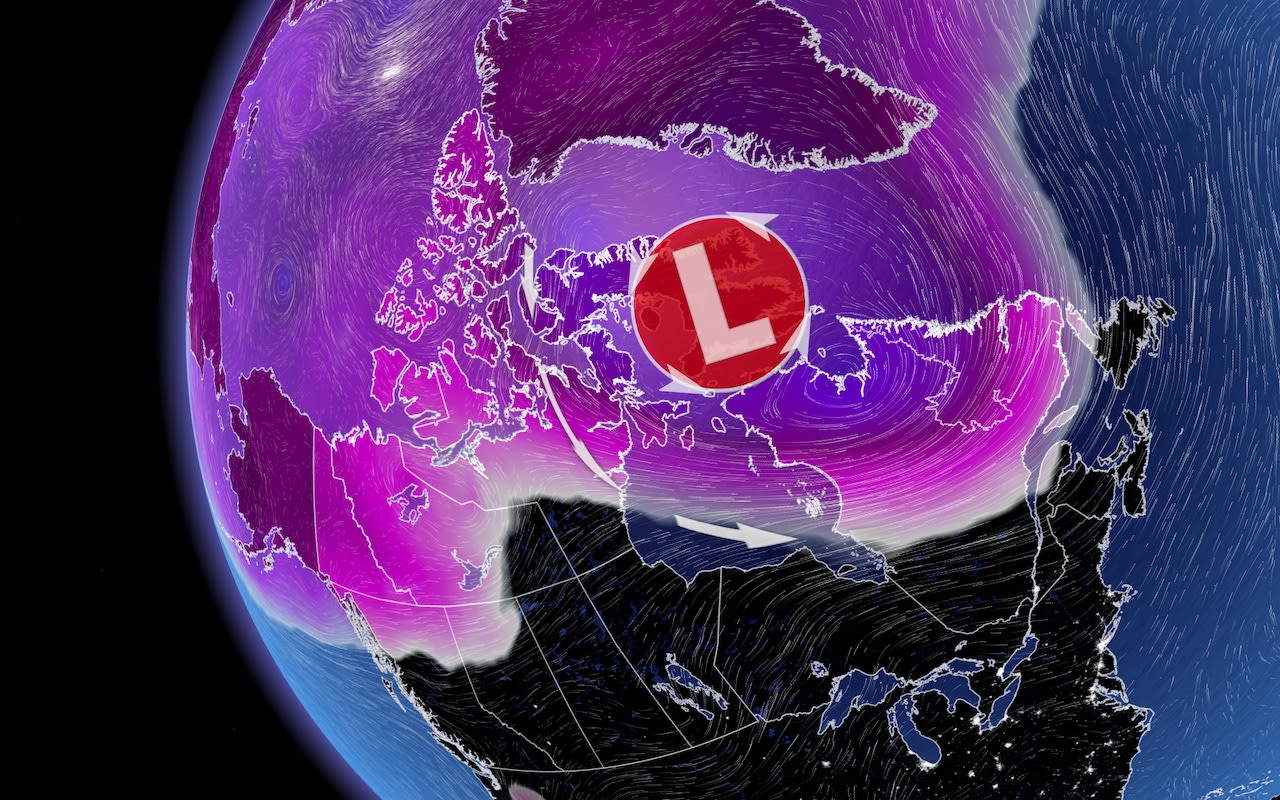
 The COLD TIMES are returning, the mid-latitudes are REFREEZING in line with historically low solar activity, cloud-nucleating Cosmic Rays, and a meridional jet stream flow (among many other forcings, including the impending release of the Beaufort Gyre).


 2.0°C above all-time record. ️-3.9°C Base Aérea Nueva Asunción ️-3.5°C Prats Gill