CORONA Main Coronavirus thread

marsh

On TB every waking moment
View: https://www.youtube.com/watch?v=nRmt78mAKfg
27:10 min
Saturday 2nd May, Global dangers
•May 2, 2020

Dr. John Campbell
COVID – 19, Saturday 2nd May, Do please share this video, people need to see this one.

IRC https://www.rescue.org/press-release/...

IRC: World risks up to 1 billion cases and 3.2 million deaths from COVID-19 across fragile countries 500 million and 1 billion infections, leading to between 1.7 to 3.2 million deaths, in 34 conflict-affected and fragile countries.

A small window of time left

Estimates are based on Chinese data, but, Less health care than china

Venezuela

Refugee camps Syria, Greece and Bangladesh

Population density, X 8.5 Diamond princess where transmission of the virus was up to four times faster than in Wuhan

Limited access to water, sanitation and hygiene found in displacement camps, the disease will spread fast and could devastate communities Yemen Somalia South Sudan Syria DRC CAR Chad Sudan Afghanistan Zimbabwe Guinea Haiti Iraq Nigeria

Imperial modelling https://www.imperial.ac.uk/media/impe... Report 12: The Global Impact of COVID-19 and Strategies for Mitigation and Suppression In the absence of interventions 7.0 billion infections 40 million deaths globally this year

Mitigation strategies Shielding the elderly (60% reduction in social contacts) + Slowing but not interrupting transmission (40% reduction in social contacts for wider population) save 20 million lives

Even in this scenario, all Health systems will be quickly overwhelmed In a typical low-income setting outstripping supply by a factor of 25 US and UK R0 = 2.4 – 3.3 3 day doubling time UK deaths, 490,000 US deaths 2,180,000 Balance of risk in LICs Lower age profile Social conditions Social unrest Malnutrition, HIV, TB, Malaria, Yellow fever, STIs

Need the rapid adoption of public health measures to suppress transmission, Testing and isolation of cases Wider social distancing measures Rapid isolation Delays in implementing strategies to suppress transmission will lead to worse outcomes and fewer lives saved. Social and economic costs of suppression, may be disproportionately in lower income settings Healthcare Availability LICs, 1.24 beds per 1000 HICs, 4.82 beds per 1000
 

marsh

On TB every waking moment
View: https://www.youtube.com/watch?v=D1iD1O95C4g
13:46 min
How do we get out of LOCKDOWN? // UK DOCTOR // Covid-19 Vlog #17
•May 2, 2020

Dr Hope's Sick Notes
(Dr. Ed Hope is a Junior ER Doc in the UK. This is his VLOG of his COVID-19 experience)

My mind has been so occupied with dealing with the initial surge in Covid-19 cases that I never considered what we do next... So on my nightshift in Emergency Department I brainstorm my thoughts.

THANK YOU TO @LEGO and Fairy Brickes (http://www.fairybricks.org) for their kind donation to the healthcare workers at our hospital.
 

ambereyes

Veteran Member
[/QUOTE]
You ever try the Dalmor or Glenmorangie?

Tried both Dalmor is 1st and a close second Glenmorangie. I'd be completely satisfied with either, they are both great. In fact my brother is supposed to pick some more up on his run to the city. He is partial to the Glenmorangie. Thanks for those recommendations.
 

Masterchief117

I'm all about the doom

People with low levels of Vitamin D may be more likely to catch coronavirus and die from COVID-19 infection, study suggests
By Joe Pinkstone For Mailonline
Published: 09:23 EDT, 1 May 2020 | Updated: 11:20 EDT, 1 May 2020

•Study compared average vitamin D levels in a country with coronavirus mortality
•Found a link showing low vitamin D levels are associated with a higher death rate
•Researchers 'believe they can advise vitamin D supplementation' to protect against the coronavirus


A preliminary study has found tentative evidence suggesting low levels of vitamin D may make it more likely an individual will die after contracting coronavirus.

The research compared average levels of vitamin D across 20 European countries with COVID-19 infection rate and mortality.

It revealed a convincing correlation where countries with low vitamin D levels were also the countries with highest mortality and COVID-19 infection rates.

The study has not yet been peer-reviewed and scrutinised by other scientists and is unable to prove vitamin D is the reason behind this link.

However, the scientists from Queen Elizabeth Hospital Foundation Trust and the University of East Anglia write in their study: 'We believe, that we can advise Vitamin D supplementation to protect against SARS-CoV2 infection.'

This finding backs up a separate study which also found vitamin D may improve a person's chance of recovery after contracting the coronavirus.

A ten-week trial from the University of Granada is currently ongoing after a recent study by Trinity College Dublin found adults who took Vitamin D supplements saw a 50 per cent fall in chest infections.

View attachment 195104
Pictured, a correlation graph showing the relationship between levels of viamin D (bottom, measured in nmol/l) and compared to infection numbers of coronavirus for 20 European countries. It reveals a convincing correlation where countries with low vitamin D levels were also the countries with highest COVID-19 infection rates

View attachment 195105
Pictured, graph showing coronavirus mortality compared to vitamin D levels per country (bottom, measured in nmol/l). The dotted line shows the overall trend revealing a correlation between vitamin D levels and COVID-19 death rates

The latest study used pre-existing data on vitamin D levels, including from a comprehensive 2019 study led by Paul Lips, Professor Emeritus of internal medicine at Vrije Universiteit Amsterdam.

This previous study collected data on vitamin D levels of populations across Europe and the Middle East.

The study involved taking vitamin D measurements of thousands of individuals.

The latest study on the vitamin's effectiveness against COVID-19 narrowed this data to 20 countries, to negate any interfering factors, such as a country's latitude.

The average amount of vitamin D in serum samples was (56 nmol/l), with anything below 30nmol/l deemed 'severely deficient'.

The latest study took the existing database of vitamin D levels and found worryingly low levels of vitamin D in the elderly, a demographic more at risk of dying after contracting the coronavirus.

'[The study shows levels of] vitamin D of 26nmol/L in Spain, 28 nmol/L in Italy and 45 nmol/L in the Nordic countries, in older people,' the researchers write.

'In Switzerland, mean vitamin D levels are 23(nmol/L) in nursing homes and in Italy 76 per cent of women over 70 years of age have been found to have circulating levels below 30nmol/L.

'These are countries with high number of cases of COVID–19 and the ageing people is the group with the highest risk for morbidity and mortality with SARS-Cov2.'

Vitamin D can make its way into the human body either through certain foods, such as fish and mushroom, or can be produced by skin cells when exposed to sunlight.

A simple statistical analysis, called a t-test, was then performed on the two sets of data to determine any relationship which unearthed the correlation between deaths and vitamin D levels.

'The most vulnerable group of population for COVID-19 is also the one that was the most deficit in vitamin D,' the researchers conclude in their preliminary report.

The study was published on pre-print site Research Square.

It remains unknown why vitamin D may offer protection against infection by the coronavirus SARS-CoV-2 and the subsequent development of COVID-19.

However, the study is backed up by previous research that was published before the emergence of the novel coronavirus.

Healthy vitamin D levels have been linked to reduced risk of other respiratory diseases, such as influenza, tuberculosis and childhood asthma.

Recently, skin cancer researcher Dr Rachel Neale said that having low levels of vitamin D can be fatal if one also has the coronavirus.

'Now, more than ever, is not the time to be vitamin D deficient,' Dr Neale told The Australian.

'It would make sense that being vitamin D deficient would increase the risk of having symptomatic COVID-19 and potentially having worse symptoms. And that's because vitamin D seems to have important effects on the immune system.'

Last year, Dr Neale found that people with low levels of vitamin D are almost twice as likely as those with high levels of vitamin D oto develop acute respiratory infections.

According to the study of 78,000 patients, people with vitamin D deficiencies were more likely to be sicker for longer.

Dr Neale said she sits in the Brisbane sun for for five to 10 minutes everyday to stimulate her body's production of vitamin D.

Trinity College Dublin published research last month which found vitamin D may be able to help reduce the severity of COVID-19.

The Irish team found the vitamin is likely involved with suppressing the severe inflammatory responses seen in seriously ill COVID-19 patients.

Professor Rose Anne Kenny, who led this research, said: 'We have evidence to support a role for Vitamin D in the prevention of chest infections, particularly in older adults who have low levels.

'In one study Vitamin D reduced the risk of chest infections to half in people who took supplements.

'Though we do not know specifically of the role of Vitamin D in COVID infections, given its wider implications for improving immune responses and clear evidence for bone and muscle health, those cocooning and other at-risk cohorts should ensure they have an adequate intake of Vitamin D.

'Cocooning is a necessity but will reduce physical activity. Muscle deconditioning occurs rapidly in these circumstances and Vitamin D will help to maintain muscle health and strength in the current crisis.'
Well, the "experts" will be saying: "Vitamin D is not FDA approved to treat Covid-19 and people shouldn't be reading "anecdotal" reports of such."
 

Ping Jockey

Inactive


Tried both Dalmor is 1st and a close second Glenmorangie. I'd be completely satisfied with either, they are both great. In fact my brother is supposed to pick some more up on his run to the city. He is partial to the Glenmorangie. Thanks for those recommendations.
[/QUOTE]
Most welcome, anytime!
 

marsh

On TB every waking moment
View: https://www.youtube.com/watch?v=89rLtqoozzc
1:00:36 min
War Room: Pandemic EP 155 - The Five Eyes Report
•Streamed live 7 hours ago

Bannon WarRoom - Citizens of the American Republic


Raheem Kassam, Jason Miller, and Jack Maxey discuss the latest on the coronavirus pandemic as the "Five Eyes" intelligence agencies release a bombshell report that the Chinese Communist Party destroyed evidence and suppressed information about anything related to the coronavirus in the run up to the global outbreak. Steve Bannon weighs while on special assignment.


____________________________________

View: https://www.youtube.com/watch?v=IaU5ZALno1s
1::01:37 min
War Room: Pandemic EP 156 - The Biden Plan (w/ Curtis Ellis)
•Streamed live 6 hours ago

Bannon WarRoom - Citizens of the American Republic


Raheem Kassam, Jason Miller, and Jack Maxey discuss the latest on the coronavirus pandemic as Joe Biden comes under more scrutiny for the Tara Reade allegations, his close relationship with the Beijing, and his lack of transparency over records that could shed more light on it all. Calling in is Curtis Ellis to give his insights on the campaign against China.
 

marsh

On TB every waking moment
View: https://www.youtube.com/watch?v=ciQ3IeF3fJ0
4:14min
Kevin Hassett: Here's when every state's economy might reopen
•May 2, 2020


Fox News
White House Economic Adviser Kevin Hassett discusses the economic impact of the coronavirus on ‘Fox and Friends.

________________________

View: https://www.youtube.com/watch?v=REtsF2PRH4o
4:50 min
Is the nation's food supply in jeopardy?
•May 2, 2020

Fox News
Iowa Gov. Kim Reynolds discusses food supply concerns as some meat plants remain closed due to coronavirus.
 

coalcracker

Veteran Member
Please explain what you mean by a "plan is unfolding." I too believe this is the product of AI (and likely more that I can't say now). Very interested in the plan and where you see it going. What is the ultimate purpose?


TT, I wish I knew, brother. At this point all I can give you is a bit of a nostalgic memory and a guess.

As a young man, I played some competitive chess. Not long afterward, computer chess programs were just hitting the scene. I still have fond memories of many a game against the program "Sargon."

The games always felt different against the computer. Chess is chess, of course, but the mechanical precision of the machine always lacked a certain feel, a certain energy. In those days the computer could still be beat, but not for long...

You may remember in 1997 when IBM's Deep Blue program beat Garry Kasparov, the best chess player in the world. A Rubicon had been crossed, and that was 23 years ago. :cry:

My guess is that AI is, right at this moment, "gaming" sequences to reach known outcomes. It's methodical and precise and amoral. Its human masters mistakenly believe that they are in control of it.

The Beast system in the book of Revelation appears to be rising.
 

marsh

On TB every waking moment
View: https://www.youtube.com/watch?v=lvPjeJbk9V4
9:47 min
When and How Will COVID-19 End? / Episode 15 - The Medical Futurist
•Apr 23, 2020


The Medical Futurist Bertalan Meshko, M.D., PhD
Now that the coronavirus has taken over our lives, I want to answer the one question that’s on everyone’s mind. When will this nightmare finally end? We have been doing and looking at forecasts about the possible scenarios - here we analyze the most popular three. Also read our article on the topic: https://medicalfuturist.com/when-and-...

___________________________

View: https://www.youtube.com/watch?v=8lmRXXZ5dGA
9:42 min
How Will Life Change After COVID-19 / Episode 16 - The Medical Futurist
•Apr 29, 2020


The Medical Futurist Bertalan Meshko, M.D., PhD

Life will never be the same after COVID-19. Even after the billions of people under lockdown will be able to resume their life, we will not be able to travel that freely or enjoy the supply chains of the world so easily. Sustainability, solidarity, and healthcare will finally take center stage.

There will be changes at every level of our lives. Maybe we should forget about handshakes forever. Maybe we will see people wearing masks everywhere. And we will unintentionally keep our distance and be more cautious around our elderly.

New habits will arise from properly washing hands to better overall hygiene and to entirely new travel habits.

In this video, I talk about exciting topics such as: - the concept of immunity passport and new ways of traveling - whether online meetings, classes, and remote work will become the new default - how artificial intelligence will take a larger role in healthcare - the importance of portable, point-of-care devices - the future of the doctor-patient relationship ... and various other things. Check them out, and share your opinion about these in a comment! Read our magazine for more about digital health and the future of medicine: https://medicalfuturist.com/magazine Join our Patreon community to get access to exclusive content and meet like-minded medical futurists: https://www.patreon.com/themedicalfut...
 

Tristan

Has No Life - Lives on TB
Yes, that would be interesting but this thing has been too chaotic for that. One would have needed to start that effort early on and staffed and resourced to actually do it in a consistent enough fashion across at least the United States.

I guess you could start the effort at any point during the pandemic and have an * noting that the data collection effort did not begin until we were X months into the process.


I agree, but I was referring more directly to the subset at the processing plant referenced before.

But 'chaotic' pretty much defines the data that we have available, doesn't it?

That's why I've believed for quite a while now, that the 'numbers' were only useful as a indication of the direction and velocity of this outbreak.

Thanks, Kris, for the efforts you've put in to trying to make something useful out of the data at hand.
 

Doomer Doug

TB Fanatic
Medical malpractice kills far more people.

Are we going to socially distance ourselves from doctors now?

DD, I still say we all need to nominate you for calling play-by-play on Armageddon. Get all the fans spun up by getting their panic pumps run up past 400hz.
Um, over the last 26 hours 1861 people have died, from 1345 yesterday, to 1545 today. 34,555 cases in the same time frame for 1 million, 157,421 and 67,248 total dead. We are running 30,000 plus cases per day since we have added over 62,211 cases in two days and 3387 the last two dsys, some 1700 per day, so far.
If Kris's numbers don't change FAST we are looking at an additional 49,000 dead from the second to the 31st, and another 957,000, or ANOTHER ONE MILLION MORE OR LESS. See, Doomer Doug thinks when you add those together you end up with 2 MILLION,114,421 CASES IN TOTAL BY MEMORIAL DAY AND 116,548 DEAD!!!! Same time frame. Ergo my doubters what do you think the sheeple do when the dead number is over 110,000?
 

SSTemplar

Veteran Member
That would be the next logical step.

Granted we would have some "reform" mixed in there to delay things a bit, but the path is set it is only a question of how long before we reach the end.

For those who are big on comparing the USA to the Roman Empire, you will see a strong parallel to Rome in the 2nd century. Things move faster these days, so I don't expect another century of this corruption to occur.
[/
That would be the next logical step.

Granted we would have some "reform" mixed in there to delay things a bit, but the path is set it is only a question of how long before we reach the end.

For those who are big on comparing the USA to the Roman Empire, you will see a strong parallel to Rome in the 2nd century. Things move faster these days, so I don't expect another century of this corruption to occur.
I give use about 4 years then it's Howdy Doody time.
 

marsh

On TB every waking moment
Another wave of coronavirus will likely hit the US in the fall. Here's why
From CNN's Nicole Chavez

There are many aspects of the virus that remain unknown for scientists but older viruses offer some clues.

People usually get infected by four common coronaviruses that were first identified in the mid-1960s, according to the US Centers for Disease Control and Prevention. And those tend to peak in the winter months.

Dr. Greg Poland, a professor of medicine and infectious diseases at the Mayo Clinic, said that SARS-CoV-2, the technical name for the novel coronavirus that causes Covid-19, is likely to follow that pattern.

If that happens, a second wave of the virus would return just in time for the start of flu season. The flu has been a constant threat for Americans and devastating in recent years. The CDC estimates there were at least 39 million cases of the flu in the US and at least 24,000 deaths during the 2019-2020 season.

Poland, the director of the Mayo Clinic's Vaccine Research Group, says the combination of a second wave of Covid-19 with flu season could create "a lot of confusion" because of their overlap in symptoms and put a heavy strain on the health care system.

It wouldn't be the first pandemic to come back in force. In 2009, the US experienced a wave of cases of the H1N1 influenza virus, known as swine flu, in the spring. Months later, a second wave was reported in the fall and winter, the CDC says.

The 1918 influenza pandemic, which killed 50 million people globally and about 675,000 Americans, appeared as an initial mild spring wave in the US before a lethal second wave hit the country in September.

Read more on what can be done to prevent this:

Another wave of coronavirus will likely hit the US in the fall. Here's why and what we can do to stop it's why and what we can do to stop it
RELATEDAnother wave of coronavirus will likely hit the US in the fall. Here's why and what we can do to stop it

====

View attachment 195156

===
.
I believe I read that the flu vaccine caused a weakness that made one more susceptible to COVID 19. If that is true, we will have a really bad flu season on top of it all.
 

Doomer Doug

TB Fanatic
The real point of this virus attack is to create the conditions to replace cash with digital dollars. The new Fedcoin is what the globalists need in order to track everybody and everything. They are moving for a 2030 digital dollar global financial system and that is what corona chan is REALLY ABOUT.
 

marsh

On TB every waking moment
View: https://www.youtube.com/watch?v=76GRHxwoJik
5:01 min
COVID-19 sparks rent strikes
•May 1, 2020


ABC News
ABC News’ Will Carr reports on renters across the U.S. hitting the streets protesting rent payments during the pandemic, as millions are struggling financially.

_______________________

View: https://www.youtube.com/watch?v=V0Vwerb2JvE
4:54 min
What Happens to Landlords When Tenants Can't Pay Rent? | WSJ
•May 1, 2020

Wall Street Journal

Hundreds of thousands of renters may miss rent payments for May as the coronavirus crisis enters its third month in the U.S. For smaller landlords, that means facing their own financial crisis. WSJ’s Jason Bellini reports. Photo: Fadhila Hussein

____________________________________

View: https://www.youtube.com/watch?v=uBOejTN6jQY
4:53 min
Rent Strikes are Growing Across the Country
•May 1, 2020


VICE News
Edwin Mantanico didn’t pay rent in April, and he doesn’t plan to pay it in May. The apartment he shares with his family in LA's Boyle Heights was expensive to begin with, and now, with him and his wife out of work due to the coronavirus pandemic, it’s unsustainable. “I have to choose between paying rent or buying food for my family,” he said.

That stark choice is the way Mantanico’s organization, the LA Tenants Union, has framed recent protests targeting elected officials in California: Comida Sí, Renta No — yes to food, no to rent. It’s one of several groups around the country organizing rent strikes with the goal of forcing politicians to take drastic action to forestall the looming housing crisis. VICE News spoke to striking tenants, politicians, and landlords about the growing movement to cancel the rent.
 

Ping Jockey

Inactive
Um, over the last 26 hours 1861 people have died, from 1345 yesterday, to 1545 today. 34,555 cases in the same time frame for 1 million, 157,421 and 67,248 total dead. We are running 30,000 plus cases per day since we have added over 62,211 cases in two days and 3387 the last two dsys, some 1700 per day, so far.
If Kris's numbers don't change FAST we are looking at an additional 49,000 dead from the second to the 31st, and another 957,000, or ANOTHER ONE MILLION MORE OR LESS. See, Doomer Doug thinks when you add those together you end up with 2 MILLION,114,421 CASES IN TOTAL BY MEMORIAL DAY AND 116,548 DEAD!!!! Same time frame. Ergo my doubters what do you think the sheeple do when the dead number is over 110,000?
You’re very trusting of the numbers pronounced by those large and in charge ref the Beijing Bug. I wouldn’t trust them as far as I could throw an Abrams tank (including that gap-toothed woman vying for the orcs vp slot).

Blue state/local gubmints and hospitals fudge the numbers up to induce panic, keep control of the sheep, make it look like this crap is far worse than it is, and bring in more dollars for each bug patient. Did I mention induce panic? Fear, panic, pain... drive the masses into despair. It’s all crap.

But, it doesn’t matter really. We’re all going to die one day. Whether it is by this bug, a bullet, car wreck, heart disease, cancer... whatever. All we can do is choose to live like men and women should or sulk in some darkened corner, numb with fear and anxiety, worried that our next breath will become our demise.

Memento Mori
 
Last edited:

marsh

On TB every waking moment
View: https://www.youtube.com/watch?v=KdI3POwfvK0
1:06:44 min
COVID-19 & Dentistry:Returning to Practice: A Walkthrough of the ADA’s Guidance & Aerosol
•Premiered May 1, 2020


Henry Schein Dental
Join Dr. Gary Severance, Executive Director of Professional Relations with Henry Schein, for the latest update on how COVID-19 is affecting dentistry. Dr. Severance will be joined by Dr. David Reznik, practicing dentist and infectious disease expert, for the latest clinical updates on COVID-19, including a walkthrough of the ADA’s recently released Return to Work Toolkit . In this episode, we will also be joined by Michelle Strange, practicing hygienist, surgical assistant, volunteer, educator, and podcast co-host for “A Tale of Two Hygienists.” Michelle has implemented advanced solutions and devices to reduce and manage aerosols in the public health setting and will share her key leanings. Join Dr. Severance and Michelle for a discussion regarding how the emergence of COVID-19 has brought new challenges and potential liabilities to dental professionals in regards to spatter, spray, and aerosols production. Dental literature shows that many procedures produce aerosols and droplets that can be contaminated with bacteria and blood, and represent a potential route for disease transmission. There have been several devices created to decrease airborne contamination by reducing the number of aerosols and spatter, but proper practice controls are critical. Michelle and Dr. Severance will discuss these standard precautions as well as: •The key differences between spatter, spray, droplet, and aerosol and proper approaches to controlling each one •The types of engineering controls that may work in each dental facility to reduce aerosols and spatter •How to assess current office protocols and compare to the 2016 updated CDC guidelines for the dental health-care setting •How to create a protocol for proper dental-unit water line maintenance For more COVID-19 resources: https://www.henryschein.com/COVID19Re... https://www.henryschein.com/COVID19Ed...
 

Micro

Veteran Member
Interesting ABC vs. WSJ juxtaposition. How many of the rent protestors will be willing to show actual job losses and what if any unemployment or other government benefits received...
 

TerriHaute

Hoosier Gardener
Dramatic drop in COVID-19 death total, only 37000 now. Did the CDC ever have it at 60,000 or was that a talking point? I have never checked the official CDC website before. It appears that the CDC has subtracted the deaths that were originally assigned as COVID-19 but turned out to be caused by something else.


Note: Provisional death counts are based on death certificate data received and coded by the National Center for Health Statistics as of May 1, 2020. Death counts are delayed and may differ from other published sources (see Technical Notes). Counts will be updated periodically. Additional information will be added to this site as available.

Table 1. Deaths involving coronavirus disease 2019 (COVID-19), pneumonia, and influenza reported to NCHS by week ending date, United States. Week ending 2/1/2020 to 4/25/2020.*

Data as of May 1, 2020

Week ending date in which the death occurredCOVID-19 Deaths (U07.1)1Deaths from All CausesPercent of Expected Deaths2Pneumonia Deaths
(J12.0–J18.9)3
Deaths with Pneumonia and COVID-19
(J12.0–J18.9 and U07.1)3
Influenza Deaths
(J09–J11)4
Deaths with Pneumonia, Influenza, or COVID-19
U07.1 or J09–J18.9)5
Total Deaths37,308719,4389764,38216,5645,84690,165
2/1/2020057,266973,68804694,157
2/8/2020157,615973,67204944,167
2/15/2020056,878973,69305174,210
2/22/2020056,806983,55705364,093
2/29/2020556,843993,62636194,247
3/7/20202556,212973,719145834,312
3/14/20204953,968953,676255784,277
3/21/202049353,979954,1502264964,907
3/28/20202,71257,4301035,6241,2354107,463
4/4/20208,08264,3131158,7243,87543213,148
4/11/202012,26266,5771209,8415,46843016,744
4/18/202010,40855,0621017,6064,40221513,663
4/25/20203,27126,489492,8061,316674,777
 

marsh

On TB every waking moment
View: https://www.youtube.com/watch?v=oFL1FOI3R48
4:03 min
Experts warn coronavirus pandemic could be far from over
•May 2, 2020


CBS This Morning

Protesters across several states continue to defy stay-at-home orders. Experts warn the outbreak could stretch on even longer as people continue to gather despite guidelines to the contrary, while some states are loosening restrictions altogether. A CDC survey found that there have been almost 5,000 COVID-19 cases reported at meat processing plants around the U.S. Michael George examines how parts of the country are handling the coronavirus pandemic.
 

marsh

On TB every waking moment
View: https://www.youtube.com/watch?v=A9RLDAMnhvk
9:33 min
Why aiming for herd immunity to deal with the coronavirus still is a bad idea | DW News
•May 2, 2020


DW News (Germany)

The term “herd immunity” has been coming up a lot in the discussion of how to best slow down the spread of COVID-19. Some politicians appeared to be considering the idea. What do health experts think? And what will the human cost be?
 

marsh

On TB every waking moment
View: https://www.youtube.com/watch?v=4tOuwkC9OJI
4:35 min
Spain eases coronavirus lockdown with more than 25,000 deaths | DW News

•May 2, 2020

DW News (Germany)

Spain, the European country with the most coronavirus cases, has now surpassed 25,000 deaths. But the number of new infections is on the decline, and the country has begun easing some of its strict lockdown measures. For seven weeks, only one person per household was allowed to leave their homes to go grocery shopping or walk their dog. But starting today, Spaniards are allowed to go outside to exercise again, albeit while still under restrictions.
 

Plain Jane

Just Plain Jane

COVID-19 Data for Pennsylvania*
* Map, tables, case counts and deaths last updated at 12:00 p.m. on 5/2/2020
Source: Pennsylvania National Electronic Disease Surveillance System (PA-NEDSS) as of 12:00 a.m. on 5/2/2020


Case Counts, Deaths, and Negatives
Total Cases*DeathsNegative
48,3052,418187,071

* Total case counts include confirmed and probable cases.


Hospital Data
Trajectory Animations


Positive Cases by Age Range to Date
Age RangePercent of Cases*
0-4< 1%
5-12< 1%
13-181%
19-246%
25-4938%
50-6427%
65+27%
* Percentages may not total 100% due to rounding


Hospitalization Rates by Age Range to Date
Age RangePercent of Cases
0-292%
30-495%
50-6410%
65-7920%
80+20%


County Case Counts to Date
CountyTotal CasesNegativesDeaths
Adams14116054
Allegheny133316646102
Armstrong527102
Beaver435214268
Bedford242141
Berks28105786118
Blair2310350
Bradford356982
Bucks31828881237
Butler18023046
Cambria3212991
Cameron1530
Carbon182109615
Centre969501
Chester14695609117
Clarion234931
Clearfield164550
Clinton342520
Columbia29065713
Crawford196990
Cumberland365158517
Dauphin617378325
Delaware39999391255
Elk41710
Erie9020342
Fayette8218784
Forest7300
Franklin32530538
Fulton6890
Greene274290
Huntingdon483070
Indiana637554
Jefferson63220
Juniata841611
Lackawanna968265683
Lancaster19048148112
Lawrence657586
Lebanon710272410
Lehigh2896750883
Luzerne2211522997
Lycoming8111731
McKean61750
Mercer667721
Mifflin387000
Monroe1165282555
Montgomery448717930369
Montour4929660
Northampton2182654894
Northumberland986150
Perry332331
Philadelphia1294829612422
Pike394129415
Potter4840
Schuylkill38421367
Snyder332041
Somerset296211
Sullivan1340
Susquehanna843029
Tioga162561
Union385700
Venango72560
Warren11800
Washington11821952
Wayne1045445
Westmoreland396474926
Wyoming251752
York664732711
View as a clickable county or zip code level mapOpens In A New Window


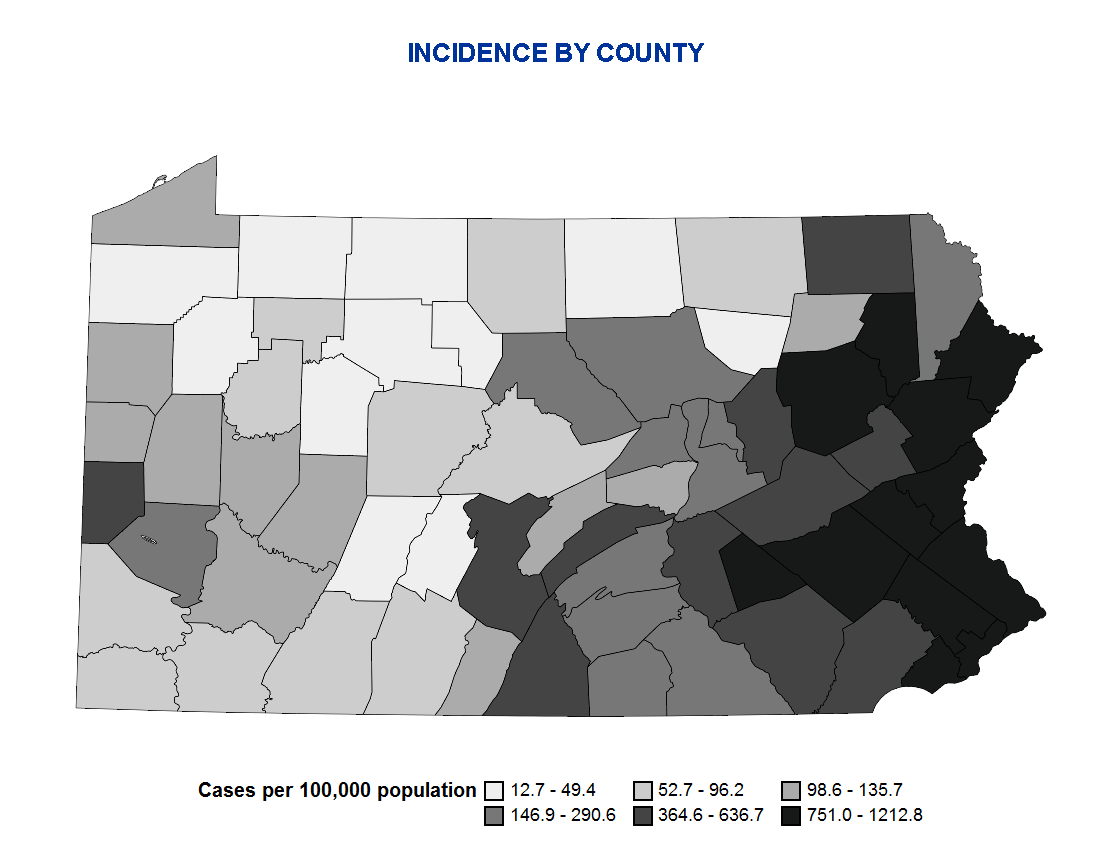
Incidence by County


Incidence%20by%20County.png

Incidence is calculated by dividing the current number of confirmed and probable COVID-19 cases reported to the Department by the 2018 county population data available from the Bureau of Health Statistics. The counties are divided into 6 relatively equally-sized groups based on their incidence rate (i.e. sestiles). Cases are determined using a national COVID-19 case definition. There currently is no way to estimate the true number of infected persons. Incidence rates are based on the number of known cases, not the number of true infected persons.

Case Counts and Deaths by Sex to Date


SexPositive Cases Percent of Cases*Deaths
Female26,21154%1,155
Male21,48344%1,252
Neither30%0
Not reported6081%11
* Percentages may not total 100% due to rounding


Case Counts and Deaths by Race to Date*


RacePositive CasesPercent of Cases** Deaths
African American/Black5,16111%235
Asian5331%28
White10,60022%899
Other227<1%8
Not reported31,78466%1,248
* 66% of race is not reported. Little data is available on ethnicity.

** Percentages may not total 100% due to rounding


Case Counts by Region to Date


RegionPositiveNegativeInconclusive
Northcentral740845913
Northeast101322817794
Northwest280639811
Southcentral29992281644
Southeast3079987493570
Southwest26553372825

EpiCurve by Region

EpiCurve%20by%20Region.png

Case counts are displayed by the date that the cases were first reported to the PA-NEDSS surveillance system. Case counts by date of report can vary significantly from day to day for a variety of reasons. In addition to changes due to actual changes in disease incidence, trends are strongly influenced by testing patterns (who gets tested and why), testing availability, lab analysis backlogs, lab reporting delays, new labs joining our electronic laboratory reporting system, mass screenings, etc. Trends need to be sustained for at least 2-3 weeks before any conclusions can be made regarding the progress of the pandemic.

COVID-19 Cases Associated with Nursing Homes and Personal Care Homes to Date

Facility CountyNumber of Facilities with CasesNumber of Cases Among ResidentsNumber of Cases Among EmployeesNumber of Deaths
ADAMS11744
ALLEGHENY332919379
ARMSTRONG1440
BEAVER22812261
BERKS204906575
BUCKS47781147175
BUTLER512102
CAMBRIA11.0
CARBON245412
CENTRE2320
CHESTER2943447103
CLARION1110
CLEARFIELD22.0
COLUMBIA2782517
CUMBERLAND41694216
DAUPHIN41022017
DELAWARE43894129192
ERIE4320
FAYETTE13.1
FRANKLIN53052
INDIANA21214
LACKAWANNA133845766
LANCASTER2742010789
LAWRENCE2020
LEBANON44265
LEHIGH234037656
LUZERNE162903564
LYCOMING22330
MERCER11.0
MIFFLIN2110
MONROE81232822
MONTGOMERY78141545294
NORTHAMPTON1149010655
NORTHUMBERLAND1620
PHILADELPHIA5213474164
PIKE22345
SCHUYLKILL51910
SUSQUEHANNA344129
UNION1010
WASHINGTON3621
WAYNE1010
WESTMORELAND81293023
YORK4821
PENNSYLVANIA478882711481614
 

marsh

On TB every waking moment
View: https://www.youtube.com/watch?v=q9MhoVpHAeg
13:17 min
Italy's coronavirus journey: 'People don't sing from balconies anymore'
•May 1, 2020

Sky News

Coronavirus continues to spread globally but Italy was the first country in Europe to experience the devastating effects of the disease. The first to go under full lockdown, Sally Lockwood's special report explores the effects on the country right from the beginning of the most unprecedented crisis the world has ever seen. The shocking centre of the COVID-19 crisis: https://www.youtube.com/watch?v=_J60f...
 

marsh

On TB every waking moment
View: https://www.youtube.com/watch?v=uG95eJiLmHA
46:36 min
Arvind Kejriwal Exclusive: Open Delhi, We Are Ready For COVID-19 Challenge
•Premiered 10 hours ago

India Today


Delhi chief Minister Arvind Kejriwal on Saturday said he was expecting that some parts of Delhi would be placed in the Orange and Green Zones so that some economic activities could be restarted there. He said while he appreciates the Centre's decision to go with lockdown early on and extend it from time-to-time, he disagrees with the criteria of putting entire districts under Red Zones based on cases in one or two localities.

Watch the latest live English news and updates on India Today. #IndiaTodayLive #IndiaNewsLive #LatestNewsIndia #EnglishNews
 

Doomer Doug

TB Fanatic
Dramatic drop in COVID-19 death total, only 37000 now. Did the CDC ever have it at 60,000 or was that a talking point? I have never checked the official CDC website before. It appears that the CDC has subtracted the deaths that were originally assigned as COVID-19 but turned out to be caused by something else.


Note: Provisional death counts are based on death certificate data received and coded by the National Center for Health Statistics as of May 1, 2020. Death counts are delayed and may differ from other published sources (see Technical Notes). Counts will be updated periodically. Additional information will be added to this site as available.

Table 1. Deaths involving coronavirus disease 2019 (COVID-19), pneumonia, and influenza reported to NCHS by week ending date, United States. Week ending 2/1/2020 to 4/25/2020.*

Data as of May 1, 2020

Week ending date in which the death occurredCOVID-19 Deaths (U07.1)1Deaths from All CausesPercent of Expected Deaths2Pneumonia Deaths
(J12.0–J18.9)3
Deaths with Pneumonia and COVID-19
(J12.0–J18.9 and U07.1)3
Influenza Deaths
(J09–J11)4
Deaths with Pneumonia, Influenza, or COVID-19
U07.1 or J09–J18.9)5
Total Deaths37,308719,4389764,38216,5645,84690,165
2/1/2020057,266973,68804694,157
2/8/2020157,615973,67204944,167
2/15/2020056,878973,69305174,210
2/22/2020056,806983,55705364,093
2/29/2020556,843993,62636194,247
3/7/20202556,212973,719145834,312
3/14/20204953,968953,676255784,277
3/21/202049353,979954,1502264964,907
3/28/20202,71257,4301035,6241,2354107,463
4/4/20208,08264,3131158,7243,87543213,148
4/11/202012,26266,5771209,8415,46843016,744
4/18/202010,40855,0621017,6064,40221513,663
4/25/20203,27126,489492,8061,316674,777

This is bull shit there are THOUSANDS DEAD IN THE NURSING HOMES ALONE.
 

bw

Fringe Ranger
The real point of this virus attack is to create the conditions to replace cash with digital dollars. The new Fedcoin is what the globalists need in order to track everybody and everything. They are moving for a 2030 digital dollar global financial system and that is what corona chan is REALLY ABOUT.

No, Corona Chan is just Corona Chan. The various nefarious actors are leveraging the chaos to implement what they had in mind all along, but that's not anywhere near saying the virus was created in order to implement digital dollars.
 

Kris Gandillon

The Other Curmudgeon
_______________
Um, over the last 26 hours 1861 people have died, from 1345 yesterday, to 1545 today. 34,555 cases in the same time frame for 1 million, 157,421 and 67,248 total dead. We are running 30,000 plus cases per day since we have added over 62,211 cases in two days and 3387 the last two dsys, some 1700 per day, so far.
If Kris's numbers don't change FAST we are looking at an additional 49,000 dead from the second to the 31st, and another 957,000, or ANOTHER ONE MILLION MORE OR LESS. See, Doomer Doug thinks when you add those together you end up with 2 MILLION,114,421 CASES IN TOTAL BY MEMORIAL DAY AND 116,548 DEAD!!!! Same time frame. Ergo my doubters what do you think the sheeple do when the dead number is over 110,000?
DD:

Your numbers by Memorial Day are actually a bit low. Not only is the situation exponential but it is compounding daily just like compound interest on a savings account.

If the day-over-day rate of increase remains at 3.08% which is where we are today, Memorial Day (May 25th) will result in a total of 2,338,623 Confirmed Cases in the USA and likely around 140,119 dead if the correlation between Confirmed Cases and Deaths continues as it has for the last several weeks.
 
Last edited:

Plain Jane

Just Plain Jane
PA has released its criteria for reopening a region. This article was written for a South Central PA readership but discussed the whole state.


Many Pennsylvania counties can look forward to starting to reopen come May 8. How close are you?
Updated May 01, 1:34 PM; Posted May 01, 5:10 AM


By Charles Thompson | cthompson@pennlive.com


If things go as advertised, Pennsylvanians should learn sometime later Friday about which parts of the state can plan for a limited economic reopening and relief from statewide stay-at-home coronavirus pandemic orders effective May 8.

Which begs the question: Does my area have a chance?

We took a fresh look at new case totals through midnight April 29 - the most publicly-discernible of the Wolf Administration’s metrics - and here’s the hard truth: For most of us in south central Pennsylvania - including Harrisburg, Lancaster and York - it’s looking like maybe next time.

The lone exception is Perry County, the smallest in our eight-county region, where the rate of 28.1 newly-diagnosed cases of COVID-19 per 100,000 residents over the last two weeks is cruising along well below the state’s baseline of 50 for an area to be considered for a move from “red” to “yellow.”


All seven other counties are above 50, making it seem unlikely that we’re going to see quick changes in status for most residents in our nearly 1.9 million population region.


Next closest are the southern border counties of York and Adams, with case prevalance rates of 55.2 and 68.0, respectively. That feels close enough that some of the Wolf Administration’s other metrics - COVID-19 testing capacities, a robust ability to do contact tracing, the ability to quarantine clusters of new patients - might come into play.

Health Secretary Dr. Rachel Levine has repeatedly stressed that the case-count threshold will not be the only thing looked at in the phased reopening process. But she also said Thursday that “if we see a county which has significantly more than fifty per one hundred thousand, it’s much less likely to go to yellow.”


So, it feels more likely this morning that those counties may be just a couple of more good social distancing days away.


We also give a special distinction to Cumberland County, perched due west across the Susquehanna River from Harrisburg.


Cumberland, at first blush, seems to be nowhere close to consideration for a move to the yellow stage with a new case prevalance count of 81.3, and rising over the last week. But Cumberland’s counts appear to be significantly inflated by bad outbreaks at a handful of the county’s nursing homes.

The state Health Department’s case counts show infections among nursing home residents soaring from 30 on April 16 to 160 as of April 30, accounting for more than 60 percent of all new positive tests in the county over those two weeks. (Another 35 new cases were identified as nursing home staff.)


If you back out just the residents’ cases, on the argument that they are effectively isolated from the population-at-large, Cumberland’s adjusted new case prevalance figure drops to 30.0.


Levine has said that kind of nursing home carve-out is not likely at this point, and a Temple University professor of epidemiology and biostatistics backed her up on the point in an interview with PennLive Thursday.


"I would err on the side of still including them (the homes) because you have the licensed practical nurses, the people who are making sure the food is cooked, the administrative staff that are probably still having to show up in offices at those nursing homes that are going to be at the gas pumps, and in the grocery store, and in the drive-through line,” assistant professor Krys Johnson said.

While theoretically it’s a closed system for the residents, it’s not a closed system for the working staff that’s still as essential as it gets, and they still need to access all those services around the county.”


The four other counties in our regional analysis are much farther away from stated goal: Dauphin, 106.7 new cases per 100,000 as of Monday night; Franklin, 131.6; Lancaster, 145.7; and Lebanon, 208.8.


As you can see from the map above, the prognosis looks much better for western Pennsylvania and the most of the rest of the 'T' that runs up the central of the state and then spreads out across the northern tier counties. Wolf and Levine had said those regions would be among the first considered for their staged reopening plan, and their case numbers continue to look good.

A top physician at Pittsburgh-based UPMC said Thursday the rate of new cases is declining across most of its hospital network.


“I’m happy to report that in Allegheny County, and in the vast majority of counties that UPMC serves in Pennsylvania.... the number of COVID-19 positive cases have been declining,” said Dr. Don Yealy, the network’s emergency medicine chair.


“We expect that on May 8th, we’ll still be below the fifty cases per one hundred thousand that the Commonwealth is looking for to consider loosening those restriction that exist. We expect to reach that same rate across virtually all the counties and areas that UPMC serves, with the possible exception of south central Pennsylvania," Yealy said.

Gov. Tom Wolf announced a three-phase plan to reopen Pennsylvania last month by red, yellow and green stages.


Keep in mind, the yellow phase isn’t exactly a return to normal activity. For counties moving into that status, more businesses could open up, to be sure. But working from home will still be encouraged, masks will still be required in public and gyms, casinos, movie theaters and restaurant dining rooms will still be closed. Gatherings of more than 25 would be barred.


COVID-19 reopening phases


The one-week heads-up is designed to give local officials and business owners a fair chance to prepare. State officials have not defined thresholds for moving a region from yellow to green.


Friday’s announcements here come as more than a dozen other states have begun to partially reopen their economies and restart public life, raising concerns among health experts about another spike in COVID-19 cases that may not be detected in official numbers for two weeks.


Pennsylvania’s reliance on a specific new case prevalance metric to guide the reopening here appears to be unique among our neighboring states. Many of Pennsylvania’s regional neighbors are pegging their reopening plans more broadly to declines in COVID-19 hospitalizations, and in the use of intensive care beds.


But Temple’s Johnson endorsed it Thursday.


“I think it’s really good that we have that metric and I don’t think it’s unattainable," she said. "I think it’s a conservative measure for good reason considering less than ten percent of our population has been exposed to it (the coronavirus) and I think that we don’t know if... immunity occurs and if so for how long.”


One potential concern raised by some local elected officials is that as the state continues to ramp up testing capacity, that will inherently increase the number of positive results, making it harder to hit the 50-case-per-100,000 threshold.


Johnson sees that as a possibility in the near term, too, but “I think that’s OK for the time being because we would much rather continue to have those more pro-active measures in place early on," she said. "Once we get to where we’ve actually finally tested enough people, then we would pretty quickly thereafter start seeing things drop off.”

Levine, for her part, said because testing will largely be limited to persons with COVID-19 symptoms at least for the rest of the spring, she doesn’t see a major uptick in cases happening from those numbers alone.
 

Doomer Doug

TB Fanatic
DD:

Your numbers by Memorial Day are actually a bit low. Not only is the situation exponential but it is compounding daily just like compound interest on a savings account.

If the day-over-day rate of increase remains at 3.08% which is where we are today, Memorial Day (May 25th) will result in a total of 2,338,623 Confirmed Cases in the USA and likely around 140,119 dead if the correlation between Confirmed Cases and Deaths continues as it has for the last several weeks.
Gee, I'm a pollyanna?.:angl::D
 

Kris Gandillon

The Other Curmudgeon
_______________
Dramatic drop in COVID-19 death total, only 37000 now. Did the CDC ever have it at 60,000 or was that a talking point? I have never checked the official CDC website before. It appears that the CDC has subtracted the deaths that were originally assigned as COVID-19 but turned out to be caused by something else.


Note: Provisional death counts are based on death certificate data received and coded by the National Center for Health Statistics as of May 1, 2020. Death counts are delayed and may differ from other published sources (see Technical Notes). Counts will be updated periodically. Additional information will be added to this site as available.

Table 1. Deaths involving coronavirus disease 2019 (COVID-19), pneumonia, and influenza reported to NCHS by week ending date, United States. Week ending 2/1/2020 to 4/25/2020.*

Data as of May 1, 2020

Week ending date in which the death occurredCOVID-19 Deaths (U07.1)1Deaths from All CausesPercent of Expected Deaths2Pneumonia Deaths
(J12.0–J18.9)3
Deaths with Pneumonia and COVID-19
(J12.0–J18.9 and U07.1)3
Influenza Deaths
(J09–J11)4
Deaths with Pneumonia, Influenza, or COVID-19
U07.1 or J09–J18.9)5
Total Deaths37,308719,4389764,38216,5645,84690,165
2/1/2020057,266973,68804694,157
2/8/2020157,615973,67204944,167
2/15/2020056,878973,69305174,210
2/22/2020056,806983,55705364,093
2/29/2020556,843993,62636194,247
3/7/20202556,212973,719145834,312
3/14/20204953,968953,676255784,277
3/21/202049353,979954,1502264964,907
3/28/20202,71257,4301035,6241,2354107,463
4/4/20208,08264,3131158,7243,87543213,148
4/11/202012,26266,5771209,8415,46843016,744
4/18/202010,40855,0621017,6064,40221513,663
4/25/20203,27126,489492,8061,316674,777

I hope the numbers ARE indeed lower. If they are, John Hopkins (the data I and many others use) should eventually correct their numbers as well. The sources John Hopkins uses are:

"The Hopkins team scrapes its numbers from dozens of sources, including the U.S. Centers for Disease Control and Prevention, the World Health Organization, the European Centre for Disease Prevention and Control and the National Health Commission of the People's Republic of China, as well as U.S. state health departments and media-aggregating websites."

But also keep in mind, the CDC rarely if ever actually COUNTS anything. They ESTIMATE as they admit on their own website...at least for the FLU and I doubt they do anything much different for COVID-19.

"They" do not actually count the flu deaths. "They" ESTIMATE them. Every year.

In regards to "counting", the reasons for the broad ranges of sickness and death related to "the flu" that you will see attributed to the CDC is because THEY DON'T KNOW FOR SURE. And they have been "doing flu" for decades now. You think they really have a clue regarding Covid-19 that has been with us 5 months?

From this link in their own words: Key Facts About Influenza (Flu) | CDC

How is seasonal incidence of influenza estimated?

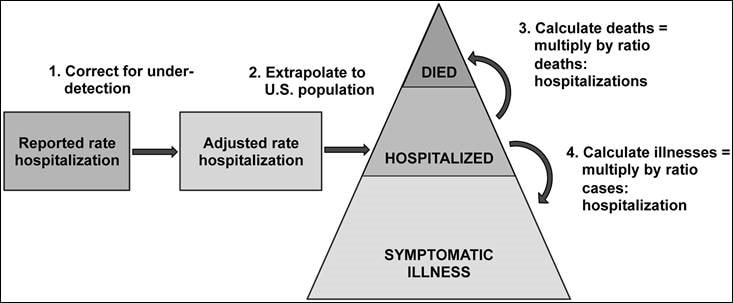
Influenza virus infection is so common that the number of people infected each season can only be estimated. These statistical estimations are based on CDC-measured flu hospitalization rates that are adjusted to produce an estimate of the total number of influenza infections in the United States for a given flu season. The estimates for the number of infections are then divided by the census population to estimate the seasonal incidence (or attack rate) of influenza.

They have contests for "forecasts" of the upcoming flu season but they don't endorse any of the forecasts but do declare winning teams:

www.cdc.gov


FluSight: Flu Forecasting
Learn about CDC's efforts with flu forecasting, which aims to predict the characteristics of flu season before disease activity occurs.
www.cdc.gov

www.cdc.gov

Flu Forecasting Accuracy Results for the 2018-2019 Season

During the 2018-2019 flu season, 24 different teams participated in the flu forecasting initiative, each submitting 38 different weekly forecasts. Los Alamos National Laboratory, led by Dr. Dave Osthus, provided the most accurate national-, regional-, and state-level influenza-like illness forecasts. This marks the first influenza season during which forecasts from Dr. Osthus’ team have been the most accurate. The Delphi group at Carnegie Mellon University, led by Dr. Roni Rosenfeld, provided the most accurate national-level hospitalization forecasts. This marks the fifth season during which forecasts provided by Dr. Rosenfeld’s team have been the most accurate.

And then you have this:

U.S. Influenza Surveillance System: Purpose and Methods | CDC
Overview of Influenza Surveillance in the United States - CDC
www.cdc.gov

www.cdc.gov

Influenza Surveillance Considerations
It is important to remember the following about influenza surveillance in the United States.
  • All influenza activity reporting by public health partners and health-care providers is voluntary.
  • The reported information answers the questions of where, when, and what influenza viruses are circulating. It can be used to determine if influenza activity is increasing or decreasing but does not directly report the number of influenza illnesses. For more information regarding how CDC classifies influenza severity and the disease burden of influenza, please see Disease Burden of Influenza.

And this shows graphically how they ESTIMATE their numbers:

How CDC Estimates the Burden of Seasonal Influenza in the U.S. | CDC
Links to key resources on the burden of influenza - CDC
www.cdc.gov

www.cdc.gov

Graphic Illustration of Influenza Burden Estimates
 
Top